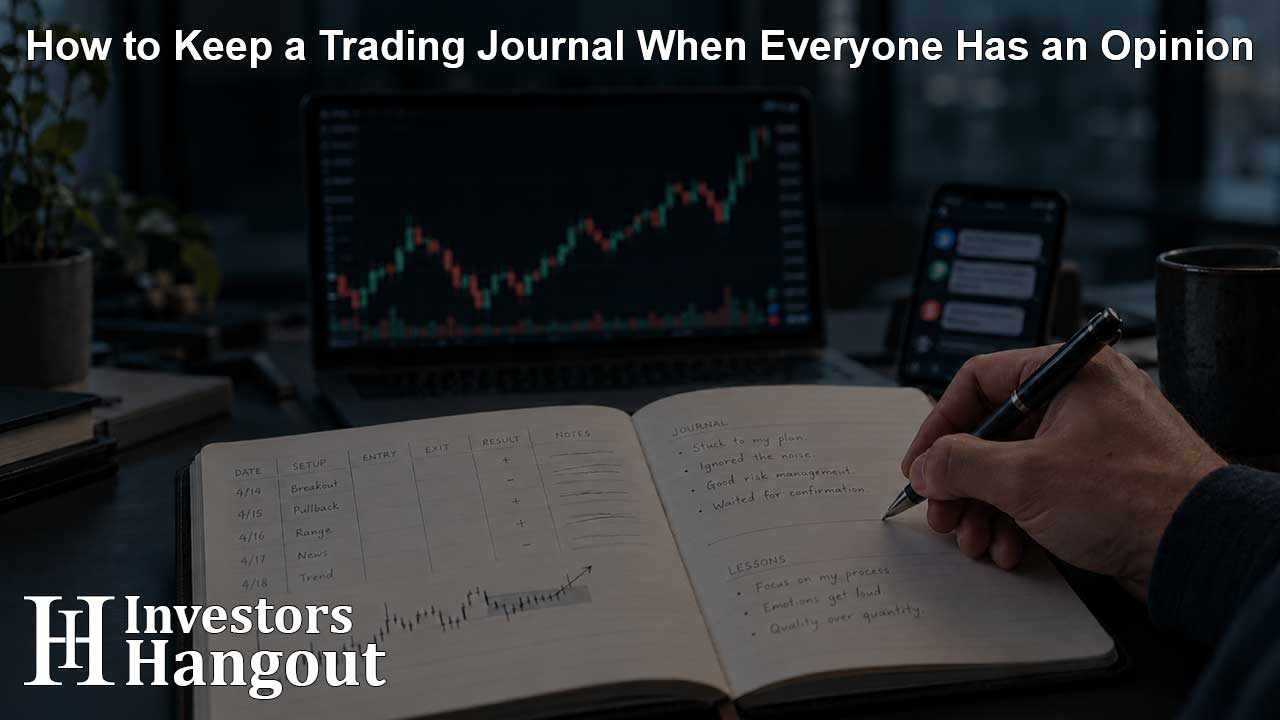
A stock clears yesterday’s high. A group chat calls it the next breakout. Someone on Facebook posts a chart predicting a reversal. Ten minutes later, a trade that began with a clear plan has a different exit, a larger position, and three competing explanations.
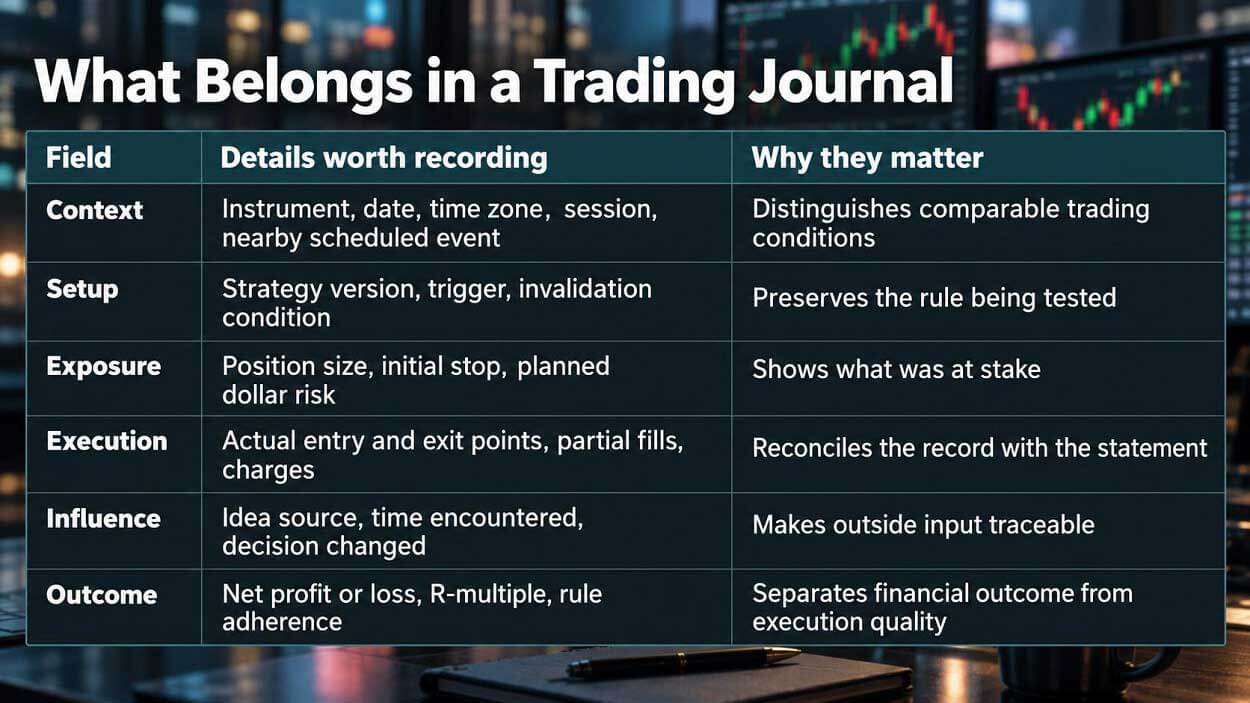
The broker’s statement will show what happened to the money. The missing details belong in a trading journal:
-
The original reason for taking the position.
-
The risk accepted before the order.
-
The outside opinion that changed a decision.
-
The actual outcome, including costs.
Understanding how to keep a trading journal only helps if you write entries immediately. Wait until the end of the session, and bias takes over. A trade driven by pure emotion easily gets reframed as a planned setup.
Create a Record That Preserves the Original Decision
An order history captures transactions. It rarely explains why a trader abandoned a target after reading a bearish comment or doubled exposure after a convincing video.
That distinction has research behind it. Brad Barber and Terrance Odean’s study All That Glitters, published in the April 2008 issue of The Review of Financial Studies, found that individual investors were net buyers of stocks attracting attention through news, unusually high volume, or extreme daily returns. The study concerned stock-buying behavior, not whether journals improve performance. Its relevance here is narrower: attention can influence which opportunities reach someone’s shortlist.
Give Outside Opinions Their Own Field
A source label makes that influence visible. “Chat-room suggestion” says where an idea originated. “Entered before confirmation after reading the chat” explains its effect on execution. Those are different observations.
An outside idea can be useful and still produce a poorly timed order. A journal needs room for both facts without turning into a scorecard for favorite commentators.
The educational initiative behind Versus Trade grows out of that same need: turning endless market noise into practical insight. The Q3 2026 digest, released September 30, marked the launch of new Blog, Learning, and Trading Glossary hubs. These resources lay the groundwork. But your journal records the actual outcome when theory meets a live order.
A Format That Survives a Busy Session
A basic spreadsheet gets the job done without extra clutter. Excel works well for quick math and filtering. Or use a paper notebook if you think better by hand. Any free option works, as long as you can quickly review past trades.
It takes little time to set up columns. Maintaining consistent definitions takes more attention. “Breakout” means little if Monday’s version requires a closing candle and Thursday’s means any brief move above resistance.
One row per completed position is a workable convention. Partial fills and exits can sit in a linked execution log, with the row showing the combined outcome. Demo and live activity need distinct labels because simulated execution and emotional pressure differ.
Best Practices for Capturing the Trade Before Memory Changes It
An elaborate template can become another task postponed until tomorrow. A compact record is more likely to survive a difficult session, especially when the account is down.
The question of what to include comes down to reconstructing the decision. Another reader should be able to distinguish the plan from later adjustments.
Capture Reasons While They Are Still Clear
Deciding what to write becomes easier with a short sentence tied to observable conditions. “Buying strength” leaves considerable room for reinterpretation. “Entered after a five-minute close above resistance; cancellation condition below the session low” preserves a testable rationale.
The same precision helps with behavior. “Felt nervous” records a mood. “Reduced the target after a bearish post, although the cancellation condition had not occurred” records a decision that can be examined later.
A short capture routine spreads the work across the position’s life:
-
Before entry: save the rationale, intended exposure, and cancellation condition.
-
During the position: timestamp any adjustment and its immediate reason.
-
After closing: reconcile actual fills and charges, then add one specific lesson.
An adjustment note can take a minute. The point is to preserve the sequence while it is observable. Missing information stays marked as missing; filling a blank from memory days later gives an uncertain recollection the appearance of a contemporaneous fact.
In a Finance Magnates interview published December 11, 2025, Karyna Tsyhanok discussed the structure behind Versus Academy’s educational approach:
“But we can remove the noise, give people structure, and build an environment where growth feels natural, not forced.”
Partnership Product Lead at Versus Trade, Karyna Tsyhanok. Finance Magnates, December 11, 2025.
Her comments concerned education. The journaling application is practical: stable fields give conflicting ideas somewhere to be assessed without quietly replacing the original plan.
Keep the First Screenshot Intact
A screenshot taken before entry preserves the visible setup. It becomes more useful with the instrument, time frame, timestamp, and marked levels. A second image after closing can show the subsequent path.
Annotations added afterward need labels. Otherwise, a support line drawn after the bounce can appear to have informed the original order. Saving the first image unchanged prevents that accidental improvement of the historical record.
A chart also leaves some things out. A quick price screenshot doesn't always tell the whole story, since it leaves out the actual bid-ask spread at the moment of execution. Noting an unusually wide spread next to the chart makes it obvious why your fill didn't match the exact number showing on screen.
Use R-Multiples Without Moving the Baseline
Dollar results become hard to compare when position sizes change. An r-multiple expresses the outcome relative to the initial planned dollar risk, commonly called 1R. Here, the calculation uses the net outcome after costs divided by that original risk allowance.
Suppose a hypothetical stock position contains 100 shares bought at $50, with an initial stop at $49. Planned price risk is $100 before charges. A sale at $52 produces $200 gross; with $4 in total charges, the net outcome is $196, or +1.96R.
The following examples keep the same original $100 baseline. They assume the stated fills and charges, without additional financing costs.
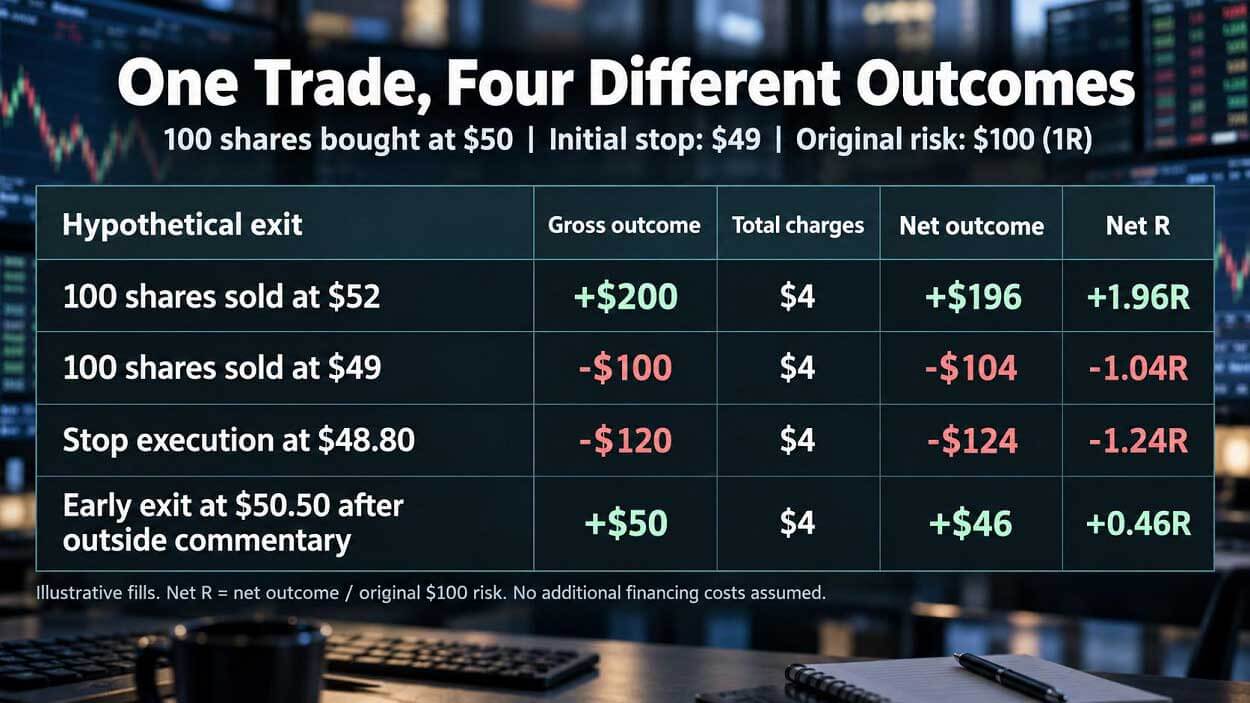
A stop order never guarantees the exact price you set. The third row tracks that gap. The fourth shows a profit despite a broken rule, though a winning trade doesn't automatically mean altering the plan was a smart move.
Moving a stop loss further out never resets your original 1R baseline. Log your initial risk right next to the new exposure. That side-by-side view keeps the true scale of the shift clear. Drop it, and an oversized loss suddenly looks completely routine once the numbers get stretched.
Keep Learning Separate From Strategy Changes
Reading up on learning trading basics helps clarify core concepts. But applying them under live market conditions is a completely different story. Applying them under live market pressure is a different story. Reviewing position sizing rules won't force you to stick to your risk limits during a volatile session.
Save new terms for separate research notes. If you decide to update a rule, put it in a dated strategy doc. Open trades must follow the setup active when you entered. Mixing old trades with new rules makes real progress impossible to measure.
A Weekly Recap That Tests the Loudest Explanation
One dramatic winner can dominate a week’s memory. Several small, repeated deviations may have had a larger combined effect.
A scheduled recap creates space to examine that possibility. The sequence can stay short:
-
Reconcile fills, position sizes, and charges against the broker’s statement.
-
Group comparable setups by strategy version, market conditions, and session.
-
Calculate net results and average R alongside rule-adherence counts.
-
Identify decisions changed by outside input and describe the changes.
-
Select one specific behavior for the next observation period.
Average R across completed positions describes that sample. That alone doesn't prove you have a real edge. Pulling off ten good trades during a strong trend won't tell you much about how that exact same setup holds up when the market turns choppy.
Compare Like With Like
Suppose outside-influenced positions performed worse. They might also have occurred during major announcements, involved different assets, or carried wider spreads. A journal points out patterns, not automatic cause and effect. Seeing market commentary right before a streak of bad trades proves nothing. Commentary before a bad stretch doesn't prove cause and effect.
Grouping similar executions helps spot real patterns. Even so, small sample sizes contain too much noise for solid conclusions. A promising setup shows up? Track it longer. One good pattern is never a reason to dismantle your strategy overnight.
Record the Trades That Stayed Unopened
Skipped setups deserve a small, separate section. Otherwise, a trader may remember the breakout missed after a pessimistic comment while forgetting several avoided losses.
Any hypothetical result needs the label “unexecuted.” A later chart cannot establish the fill, slippage, or behavior that would have occurred with money at risk. Paper outcomes do not belong in the live performance total.
Keep the Journal Useful After a Difficult Week
The urge to start again with a different method often arrives after losses. This article on breaking the strategy-hopping cycle emphasizes tracking setups, context, and how you felt during the trade. Clear records give you a solid baseline whenever an unfamiliar setup starts looking tempting.
You can still make adjustments over time. Just date each change, note the exact reason, and set a strict testing period. Doing this regularly keeps methodical updates separate from emotional tweaks.
A journal won't settle complex market arguments. Its actual job is simpler: keeping your core plan visible when market noise spikes. Over time, hard data shows what delivered and which habits drained your balance. It clearly marks where confidence outran actual execution.