The world's economic map is not static. Rankings shift as countries grow, stumble, or restructure, and the metrics used to measure strength produce very different pictures depending on what you prioritize. Nominal GDP, purchasing power parity, GDP per capita, and innovation indices each tell a different part of the story. For a trader or investor, understanding which economies are driving global growth, and why, is not just background knowledge. It shapes how you read currency moves, commodity demand, and equity market trends. This overview covers the ten strongest economies in the world as of 2026, with a focus on what makes each one relevant to financial markets.
The US and China: the Two Economies That Set the Tone
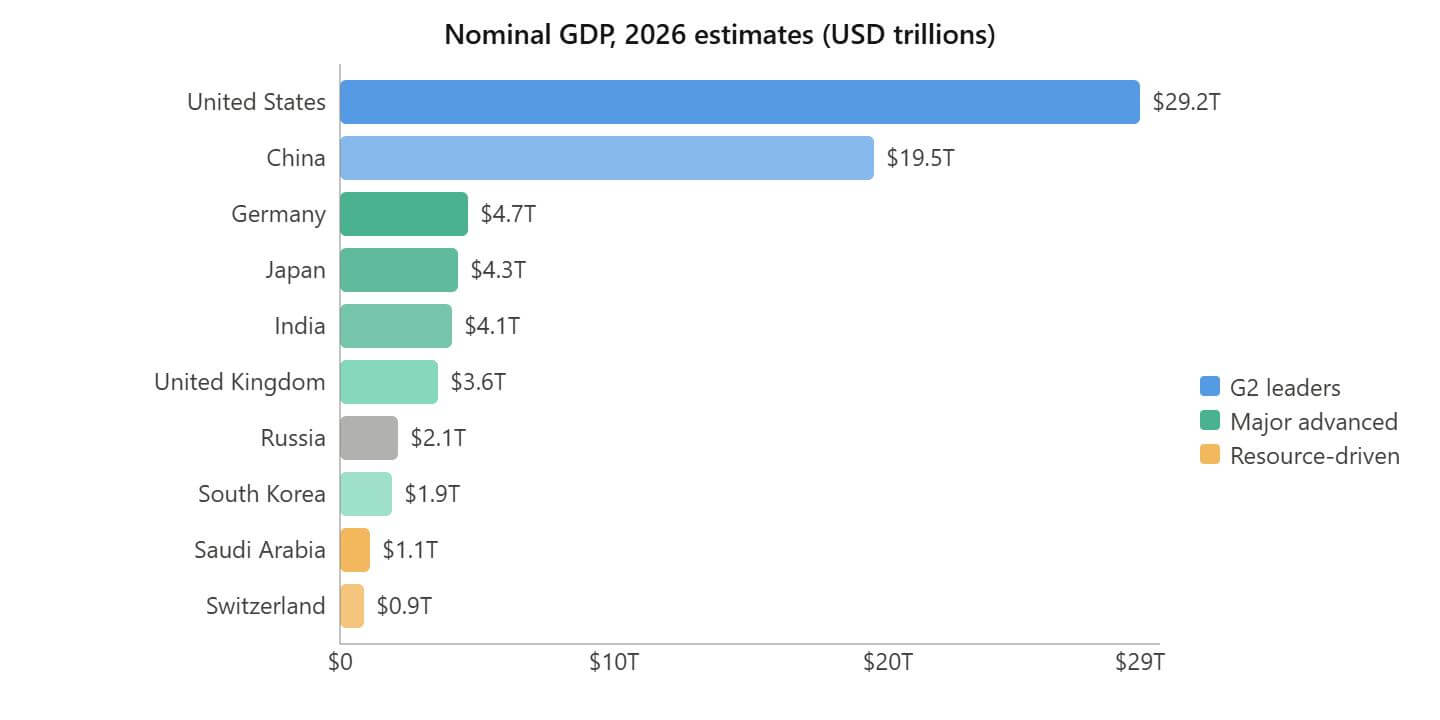
The United States remains the largest economy by nominal GDP, at roughly $29 trillion, with the dollar still functioning as the world's primary reserve currency. That status gives the US disproportionate influence over global financial conditions. When the Federal Reserve adjusts interest rates, capital flows across every major market respond. The country leads in technology, venture capital, and AI infrastructure, with companies like Nvidia, Apple, and Alphabet sitting at the top of global market capitalization rankings.
China sits just behind in nominal terms at around $19.5 trillion, but leads on purchasing power parity by a significant margin, reflecting the sheer scale of domestic activity. It remains the world's largest manufacturer and a critical trading partner for most of Asia, Africa, and Latin America. For commodity traders, Chinese industrial data, particularly steel output and energy consumption, is among the most closely watched inputs for pricing decisions.
The relationship between these two economies defines much of what moves in global markets. Trade tensions, technology restrictions, and tariff policies between Washington and Beijing create ongoing volatility in currencies, indices, and supply chains.
Europe's Anchor Economies: Germany, the UK, and Switzerland
Germany is the economic engine of the eurozone, with industry accounting for roughly 27% of gross value added, one of the highest ratios among G7 nations. Its export-oriented model means the German economy is highly sensitive to global demand cycles. A slowdown in China or a drop in US manufacturing orders registers quickly in German industrial output and, by extension, in the euro.
The United Kingdom's economic weight comes primarily from financial services. London remains one of the world's top foreign exchange trading centers, and the FCA is regarded as among the most rigorous financial regulators globally. Post-Brexit adjustments have reshaped trade relationships with Europe, but the pound continues to be one of the five most traded currencies in the world.
Switzerland, despite a relatively modest nominal GDP of around $0.9 trillion, punches well above its weight. The Swiss franc is a classic safe-haven currency, bid up during periods of global stress, and Swiss companies in pharmaceuticals and precision manufacturing hold dominant positions in global markets. GDP per capita in Switzerland ranks among the highest on the planet, reflecting the quality and productivity of its economy rather than its size.
Asia's Diverse Economic Lineup
Japan, India, and South Korea represent three distinct economic stories. Japan is the most technologically sophisticated, with deep capabilities in robotics, automotive production, and precision manufacturing. Its challenge is structural: an aging population and decades of low growth have made it a slower-moving player compared to the rest of the region, though recent inflation upticks and a shift in Bank of Japan policy have brought renewed attention from currency traders.
India is the growth story of the decade. It ranks among the top five economies by PPP and has one of the world's youngest workforces, a growing technology sector, and expanding domestic consumption. The risks are real, including income inequality, currency weakness against the dollar, and geopolitical tensions with neighbors, but the long-term trajectory draws sustained interest from equity and bond investors.
South Korea's economic identity is built around innovation. Samsung, SK Hynix, and Hyundai have turned the country into a global supplier of semiconductors, electronics, and vehicles. South Korea was also an early mover in cryptocurrency regulation, reflecting a broader national tendency to engage with new technologies ahead of most peers.
Resource-Driven Economies: Russia and Saudi Arabia
Russia's economic weight comes primarily from natural resources: oil, gas, metals, coal, and agricultural commodities. It is a structurally self-sufficient economy with low external debt relative to GDP, but one whose growth is heavily tied to commodity prices. Geopolitical pressures have redirected trade flows toward China and India and away from Europe, reshaping but not eliminating Russia's role as a major commodities supplier.
Saudi Arabia's influence on global markets is concentrated in one area: oil. As OPEC's largest member and one of the world's lowest-cost producers, Saudi production decisions directly affect Brent and WTI prices. The country is diversifying through its sovereign wealth fund, the Public Investment Fund, which holds stakes in technology, infrastructure, and international companies, but hydrocarbons remain the foundation.
The table below summarizes the primary economic driver and key market relevance for each country in the top ten:
|
Country |
Primary economic strength |
Key market relevance |
|
United States |
Technology, finance, consumer demand |
USD, S&P 500, Fed policy |
|
China |
Manufacturing, PPP scale |
CNY, commodities, EM currencies |
|
Germany |
Industrial exports |
EUR, DAX |
|
Japan |
Robotics, precision engineering |
JPY, Nikkei, carry trade |
|
India |
IT services, demographic growth |
INR, Indian equities |
|
United Kingdom |
Financial services |
GBP, FTSE 100 |
|
South Korea |
Semiconductors, electronics |
KRW, tech supply chain |
|
Switzerland |
Finance, pharmaceuticals |
CHF, safe-haven flows |
|
Russia |
Oil, gas, metals |
Commodity pricing |
|
Saudi Arabia |
Oil production, OPEC policy |
Brent, WTI crude |
What Economic Rankings Mean for Traders
Global GDP rankings are not just academic. They directly shape which currencies carry liquidity premiums, which equity markets attract foreign capital, and which commodity prices are driven by industrial demand rather than speculation.
The most practical insight is the hierarchy of currencies. Economies at the top of the nominal GDP table tend to issue the most liquid currencies with the tightest spreads. The dollar, euro, yen, pound, and yuan collectively account for the vast majority of daily Forex volume. When macroeconomic data from any of these countries surprises the market, the reverberations extend far beyond their own currency pair.
Emerging market currencies from countries like India and South Korea respond strongly to shifts in risk sentiment. When the US economy slows or trade tensions rise, capital tends to exit these markets and seek shelter in the dollar, yen, or franc. Understanding where each economy sits in the global hierarchy helps anticipate these flows before they appear in price action.
Conclusion
The ten economies covered here each lead in a different dimension. The US and China define the outer boundaries of global economic weight. Germany, Japan, and the UK represent the productive core of the developed world. India and South Korea carry the growth momentum of Asia. Switzerland is small by GDP but outsized in financial influence. Russia and Saudi Arabia anchor the commodity side of global trade. For anyone trading currencies, indices, or commodities, these economies are not just geography. They are the underlying forces that produce the price movements traders work with every day.