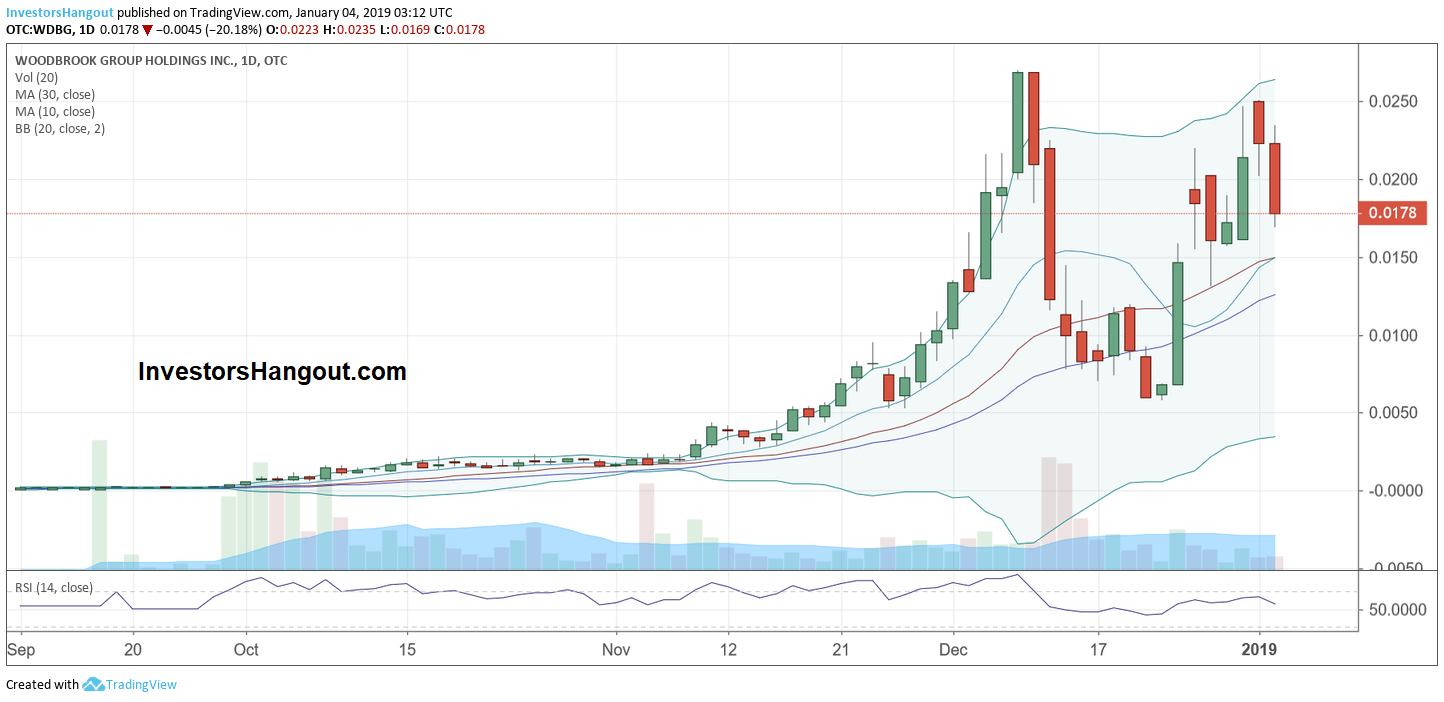
In recent months Woodbrook Group Holdings Inc stock ticker symbol WDBG has been making some wild moves up and down with it's stock price. From all of the information I have gathered the stock was trading in the .0002-.0003 range as recent as September 2018 which as of right now with the current stock price of .0178 is a 8800% gain. The stock then began a slight climb from .0002 in September to .0020 in November when WDBG opened at .0020 closing that day with no change at .0020. It was from this point forward that Woodbrook Group Holdings stock began trading much different. On November 8th 2018 WDBG opened the day at .0022 which is .0002 higher than the previous close the day before showing a bullish move forward.
WDBG started a steady climb from here following the ten day simple moving average on the chart. Shortly after on November 16th 2018 WDBG broke a resistance at .0050 for the first time, which in my opinion, began putting a lot of momentum behind the stock, sparking interests of many investors. On November 20th 2018 was the last time the stock price opened below .0050 which is when you can begin to see a trading pattern trading between the half cent marks meaning .0050/.01/.0150/.02/.0250 ect ect.
If you look at the stock chart below you will see a pattern starting around November 12-21 where the stock continuously traded between the half cents (.0050) I was talking about. November 21st 2018 - December 3rd 2018 trading was between .0050-.01 (Half cent) December 3rd 2018 - December 7th 2018 .0150-.02 and for a final pop on December 10th 2018 when the stock hit it all time high of .0269. If you bought at that price I bet you weren't too happy the next day when the stock began to drop off quickly. December 11th 2018 the stock opened at .0269 closing at .0210 roughly a 21% loss. Unfortunately December 12th was not any better whatsoever when WDBG loss another 44% with it's open of .0220 and close of .0123. After a four day free fall from December 11th at it's high of .0269 it fell for a straight five trading day period until December 17th 2018 when the stock price tapped the thirty day simple moving average at .0084 it's close of the day as well. The next few days after this, WDBG started to show some strength when the stock hit the twenty day simple moving average resistance only to drop off again below the 30 day SMA.
Then all of a sudden, on Christmas Eve December 24th 2018, all of the bulls returned at once taking the stock price on yet another wild ride opening the trading session at .0068 closing .0147 more than likely setting off a ton of stock alerts with it's massive 116.18% gain for the day! Talk about a Merry Christmas for all of those who bought the dip and for those who bought higher at .02. This was a very good sign for you as well. Again, with that half cent trading range the stock began trading .0150-.02 and then tapping out at .0250 just yesterday.
Putting the stock prices and simple moving averages to the side, another thing I noticed when looking over the chart was the volume. The volume has been very steady after it's initial surge 09-28-2018 - 10-09-2018 with average share volume between 89 million and 249 million. Yes, That is a TON of shares. However, it is important to remember that the stock was trading under .0010 per share. To put that into prospective if you bought 1 million shares on 09-28-2018 at .0002 that would have cost you only 200 bucks. Fast forward to today, assuming you didn't sell any shares whatsoever, you would have roughly 17,800 dollars in your trading account a massive 8800% GAIN! This is huge for such a short period and could have been even shorter if you sold around this same price or even higher on December 10th. Just think if you bought that 1 million shares at .0002 and sold at it's high .0270 27,000! YES! 27 THOUSAND. In literally 2 months you were able to buy a car in crash trading stocks.
The truth is you never know. Will the stock keeping going up or down? It's hard to really tell, but the only thing you can really do is watch the chart and utilize as many tools as you possibly can such as stock charts, trading data and stock message boards. Trading any stock is risky especially penny stocks such as WDBG and remember trading and investing are two different things.
WDBG Daily Chart

Who is Woodbrook Group Holdings Inc? Woodbrook Group is a fast growing financial advisory firm.
The CEO is Michael Doherty who is planning to expand WDBG and is about to make a Nasdaq Stock Market offering according to posts I've seen on this site. I tried to pull up as much information on recent developments, but without any luck. I couldn't find any recent news besides a Press Release from Wed Apr 18th, 2018 at 3:28PM titled "AmpliTech (AMPG) Group to Buyout (NHPI) at .0020 Per Share" then about an hour and a half later another Press Release at 5:15 indicating that journalists and other readers should disregard the news release from 3:28PM over GlobeNewswire. You can read this yourself here: https://investorshangout.com/recentnews/WDBG
What strikes me as odd is how limited the information is regarding this stock yet it's share price has skyrocketed over 8800 percent. This is just more proof that you can make some serious money trading penny stocks. Especially WDBG.
If you have any comments or suggestions regarding this research report please leave a comment below on the WDBG stock message board. If you would like a full break down and all historic trading prices for WDBG take a look here: https://investorshangout.com/timeandsales/WDBG
Woodbrook Group Holdings Inc (OTCMRKTS: WDBG) Stock Message Board


