IORG Daily Chart ~ Getting Ready for the Next Leg
Post# of 2561
Posted On: 03/03/2016 6:02:55 PM

IORG Daily Chart ~ Getting Ready for the Next Leg Up?
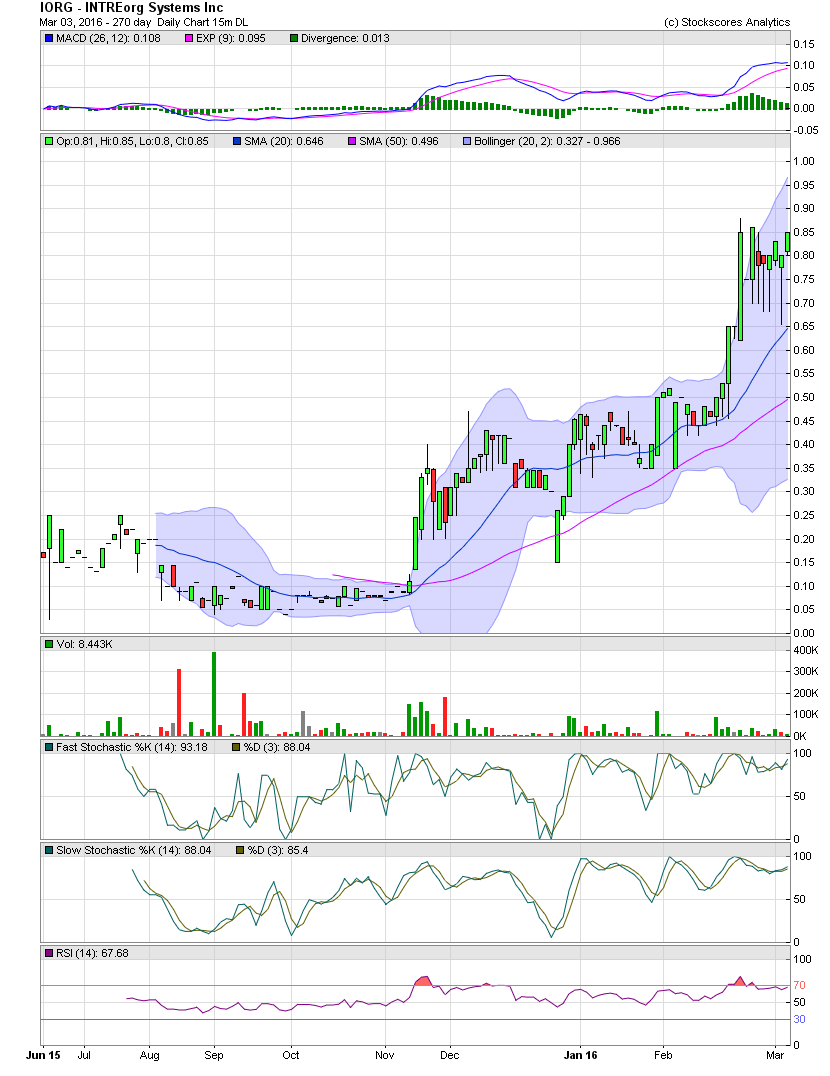
After trading outside the upper bollie two weeks ago, IORG took a break and trended sideways for a bit until back inside the bollie bands. The longer and slower term RSI indicator also traded into the overbought levels in the 70s, so there were a few technical reason to expect some consolidation/correction. There were a few very small bid whacks which dropped the stock to intraday levels of .66-.775, but for the most part, virtually all those shares were absorbed by friends of this board while others continue to accumulate the available shares on the ask. Today's close of .85 is now just .01 below the high close set 7 trading days ago. Meanwhile during the consolidation, the upper bollie has risen to accommodate any move over .95 without violating much of the technical issues. Remember, though, unless 50% or more of a daily candle trades outside the upper bollie, there really isn't much concern on my part. Others may view it differently. That said, I believe the techs and chart have reset, and in my opinion, any buying pressure will now drive the stock into the .90s. I'll post the Monthly Chart next to take all can see the multi-year highs that IORG is trading at. GLTA
After trading outside the upper bollie two weeks ago, IORG took a break and trended sideways for a bit until back inside the bollie bands. The longer and slower term RSI indicator also traded into the overbought levels in the 70s, so there were a few technical reason to expect some consolidation/correction. There were a few very small bid whacks which dropped the stock to intraday levels of .66-.775, but for the most part, virtually all those shares were absorbed by friends of this board while others continue to accumulate the available shares on the ask. Today's close of .85 is now just .01 below the high close set 7 trading days ago. Meanwhile during the consolidation, the upper bollie has risen to accommodate any move over .95 without violating much of the technical issues. Remember, though, unless 50% or more of a daily candle trades outside the upper bollie, there really isn't much concern on my part. Others may view it differently. That said, I believe the techs and chart have reset, and in my opinion, any buying pressure will now drive the stock into the .90s. I'll post the Monthly Chart next to take all can see the multi-year highs that IORG is trading at. GLTA
 (0)
(0) (0)
(0)