MPIX Daily Chart ~ An Expanded View of the Technic
Post# of 5570

MPIX Daily Chart ~ An Expanded View of the Technicals
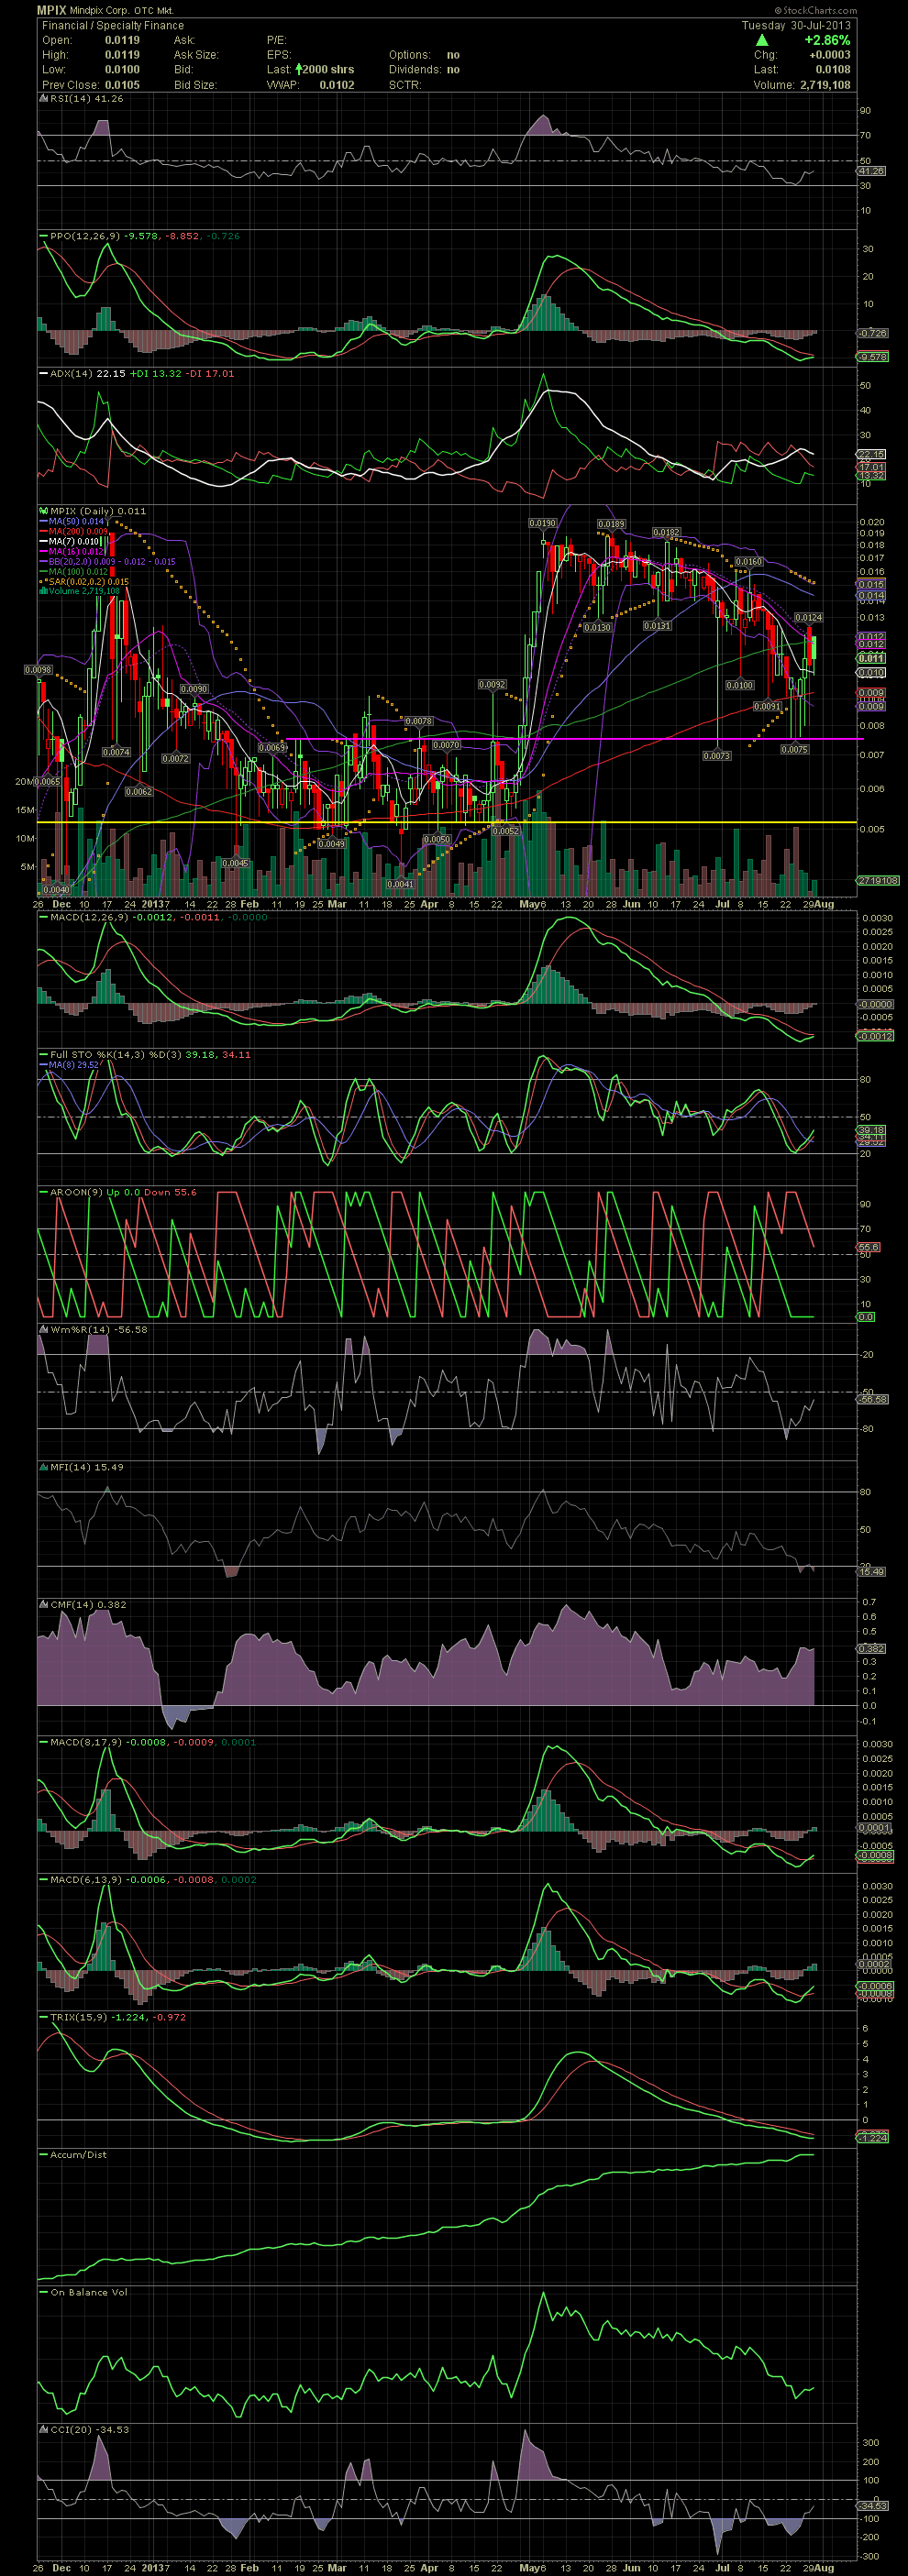
Here's a daily chart which holds many more indicators than I normally post with the abbreviated versions. For those already well versed in technicals and charts, you can see that MPIX is oversold and possibly ready for a major reversal. I'll just comment from the top down, but that's not necessarily the order of importance when I take a quick look at a chart.
The RSI has held its 30 line which is the beginning of an oversold condition. The PPO and ADX are beginning to show signs of a turn back up. Skip down past the actual chart to the longer term MACD. This indicator is very oversold and beginning to crossover from a very depressed level. Over the last few weeks, I've often mentioned the long term decline in the slower MACD. Check out what's about to transpire. The FullSto's current position, as compared to previous reversals, is also from an oversold level. Most of the moves back up occurred from a FullSto at its 20 line, and it is also ready for a bullish crossover. The Aroon, a longer term indicator which I don't use much, but also at the bottom. The Willy is bouncing up from the bottom too. The MFI is very oversold. CMF, continued money flow continues to hold up throughout the entire correction and consolidation since the stock hit .019 in early May. The next two MACDs are set to faster settings, and you can see that they have already crossed to the positive. The TRIX, also very oversold, and will turn to a buy signal within a week. The accumulation continues to trend up to new highs. The OBV, a favorite of my friend FLEX, is at the same oversold levels as just prior to the early May run from .005 to .019. The CCI is also reversing from a very oversold level. Most of these indicators are slower and longer term indicators. But they are all in approximately the same position..... oversold and ready for a major reversal imo.
Scroll back up to the actual chart now. First of all, I've annotated two horizontal lines. The lower line (yellow) was the stock's primary support level at the low .005s. The pink line was the resistance level during the months that the stock basically bounced between the .005s and .0075. Once that resistance was taken out, the stock rallied to a high of .019. The decline/correction/consolidation of the last 2.5 months saw the stock eventually trade down to what level? The previous resistance of .0075. That became a level of support, and it can clearly be seen on the chart with last week's bounce off the mid .007s. Currently, we see a convergence of the MA10, 16, 20 and 100. Close above those and technically that would be a good sign of a move to higher levels. The short term resistance would be at .0124, then the MA50 at .014, another horizontal resistance level .016 followed by the .018-.019 range. Obviously the chart and stock have some work to do before we can declare an outright buy signal. But coming off the very oversold and depressed levels of the indicators, my opinion is that this next leg will carry the stock to new highs as a lot of shares have gone into the same long term holders' hands that have been accumulating for months. Many investors I know are looking for .10, .25 and much higher prices as management is finally able to execute their business plan after months of repairing the disasters of past management's failures. The above is all my opinion, but if anyone has any questions, please send me a message. GLTA
 (0)
(0) (0)
(0)