SPDL Daily Chart ~ After Three Weeks of Consolidat
Post# of 2561
(Total Views: 1268)
Posted On: 03/13/2017 7:35:35 PM

SPDL Daily Chart ~ After Three Weeks of Consolidation, a New Short Term High Is Achieved
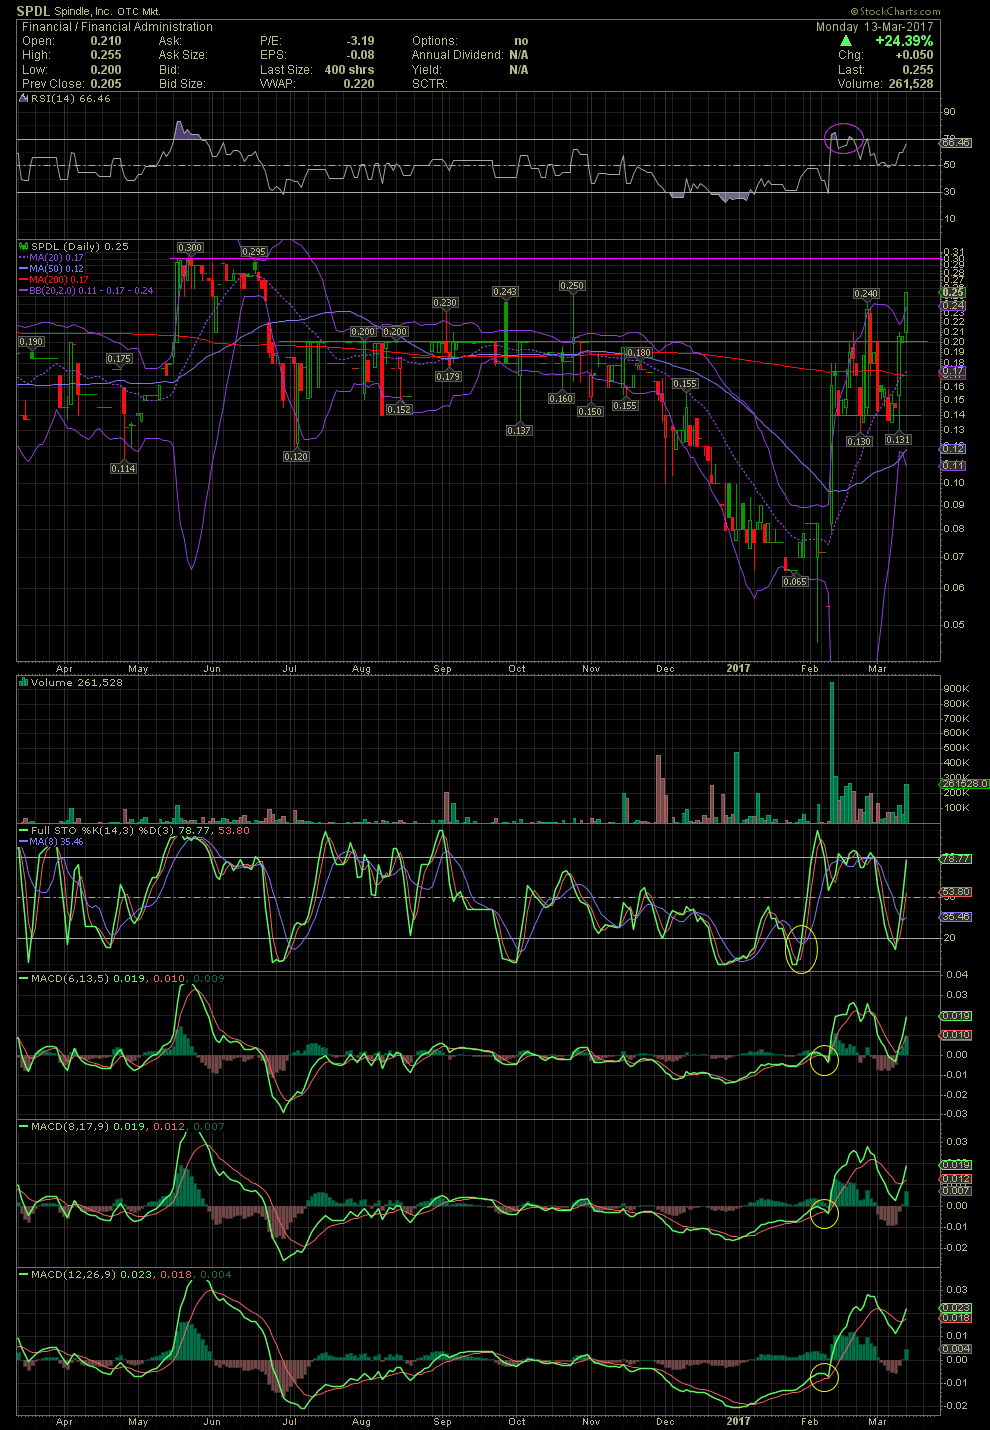
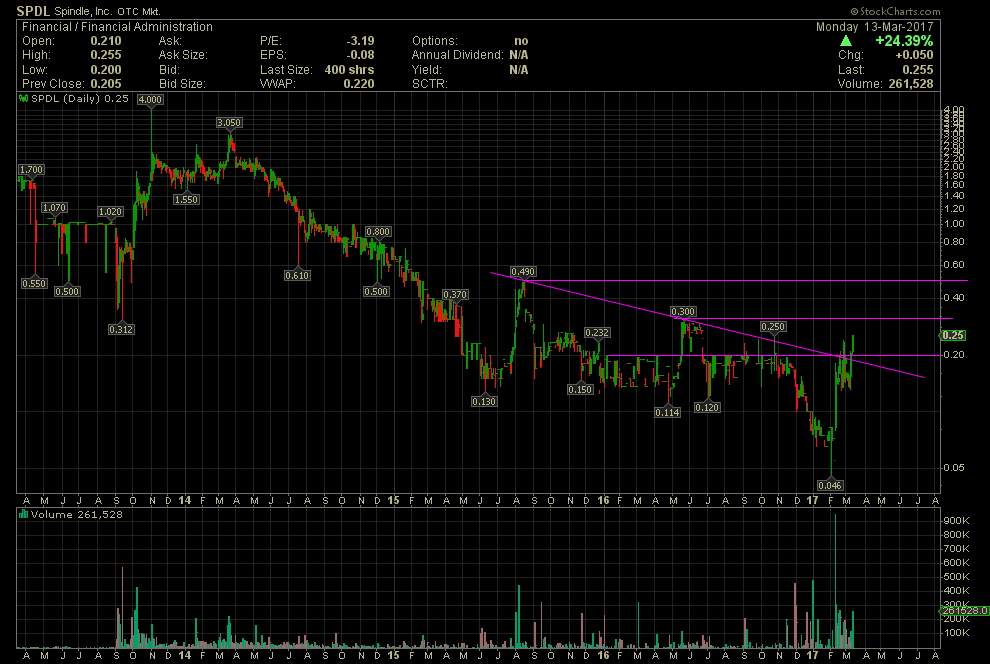
Below are two charts, the regular SPDL Daily Chart and a 4 year look at the trading history of the stock. I shared SPDL a few weeks back when the stock was trading just under .08. The stock ran to a short term high of .24 but spent most of the last three weeks consolidating and churning between .13 to .20. After allowing the technicals to reset a bit from overbought levels, you can see on the charts below that the stock broke above the horizontal resistance line on the a second attempt, including a close at its highest level since June. The next level of overhead resistance is at the .30 level stemming from previous highs in mid May thru mid June. Scrolling down to the second chart, one can see the declining tops line in place since August 2015 at .49, followed by the lower high at .30 and continuing into last October at .25. The break above this declining tops line as well as the break above the horizontal resistance line at .20, has set the stock up for a possible test of the next resistance points mentioned above. Continued accumulation and volume bodes well for new short term highs ahead. GLTA
Below are two charts, the regular SPDL Daily Chart and a 4 year look at the trading history of the stock. I shared SPDL a few weeks back when the stock was trading just under .08. The stock ran to a short term high of .24 but spent most of the last three weeks consolidating and churning between .13 to .20. After allowing the technicals to reset a bit from overbought levels, you can see on the charts below that the stock broke above the horizontal resistance line on the a second attempt, including a close at its highest level since June. The next level of overhead resistance is at the .30 level stemming from previous highs in mid May thru mid June. Scrolling down to the second chart, one can see the declining tops line in place since August 2015 at .49, followed by the lower high at .30 and continuing into last October at .25. The break above this declining tops line as well as the break above the horizontal resistance line at .20, has set the stock up for a possible test of the next resistance points mentioned above. Continued accumulation and volume bodes well for new short term highs ahead. GLTA
 (0)
(0) (0)
(0)